.png)
Introduction
Our Sun seems quiet from afar. But once we point our telescopes at it (of course, with the right filters) it exhibits a spectrum of events. For our project, we concentrated on sunspots, coronal holes and irradiance. Sunspots and coronal holes are dark regions found on the photosphere, the visible layer of the Sun, and the corona, the outermost layer, respectively. Though they are colder and darker than their surroundings their origins are different. Sunspots are formed by strong magnetic fields that hinder the transport of energy to the photosphere from the layer beneath it. While coronal holes are formed by open magnetic fields passing through the corona, carrying away the charged particles making that region of corona less dense. Since both the phenomena are occurring due to the Sun’s magnetic field, we searched for a relation between the distribution of these phenomena. We also analysed the irradiance which is the amount of energy Earth’s atmosphere receives per unit area per unit time. We used sunspot number as a proxy to the solar activity and sought to investigate its variation.
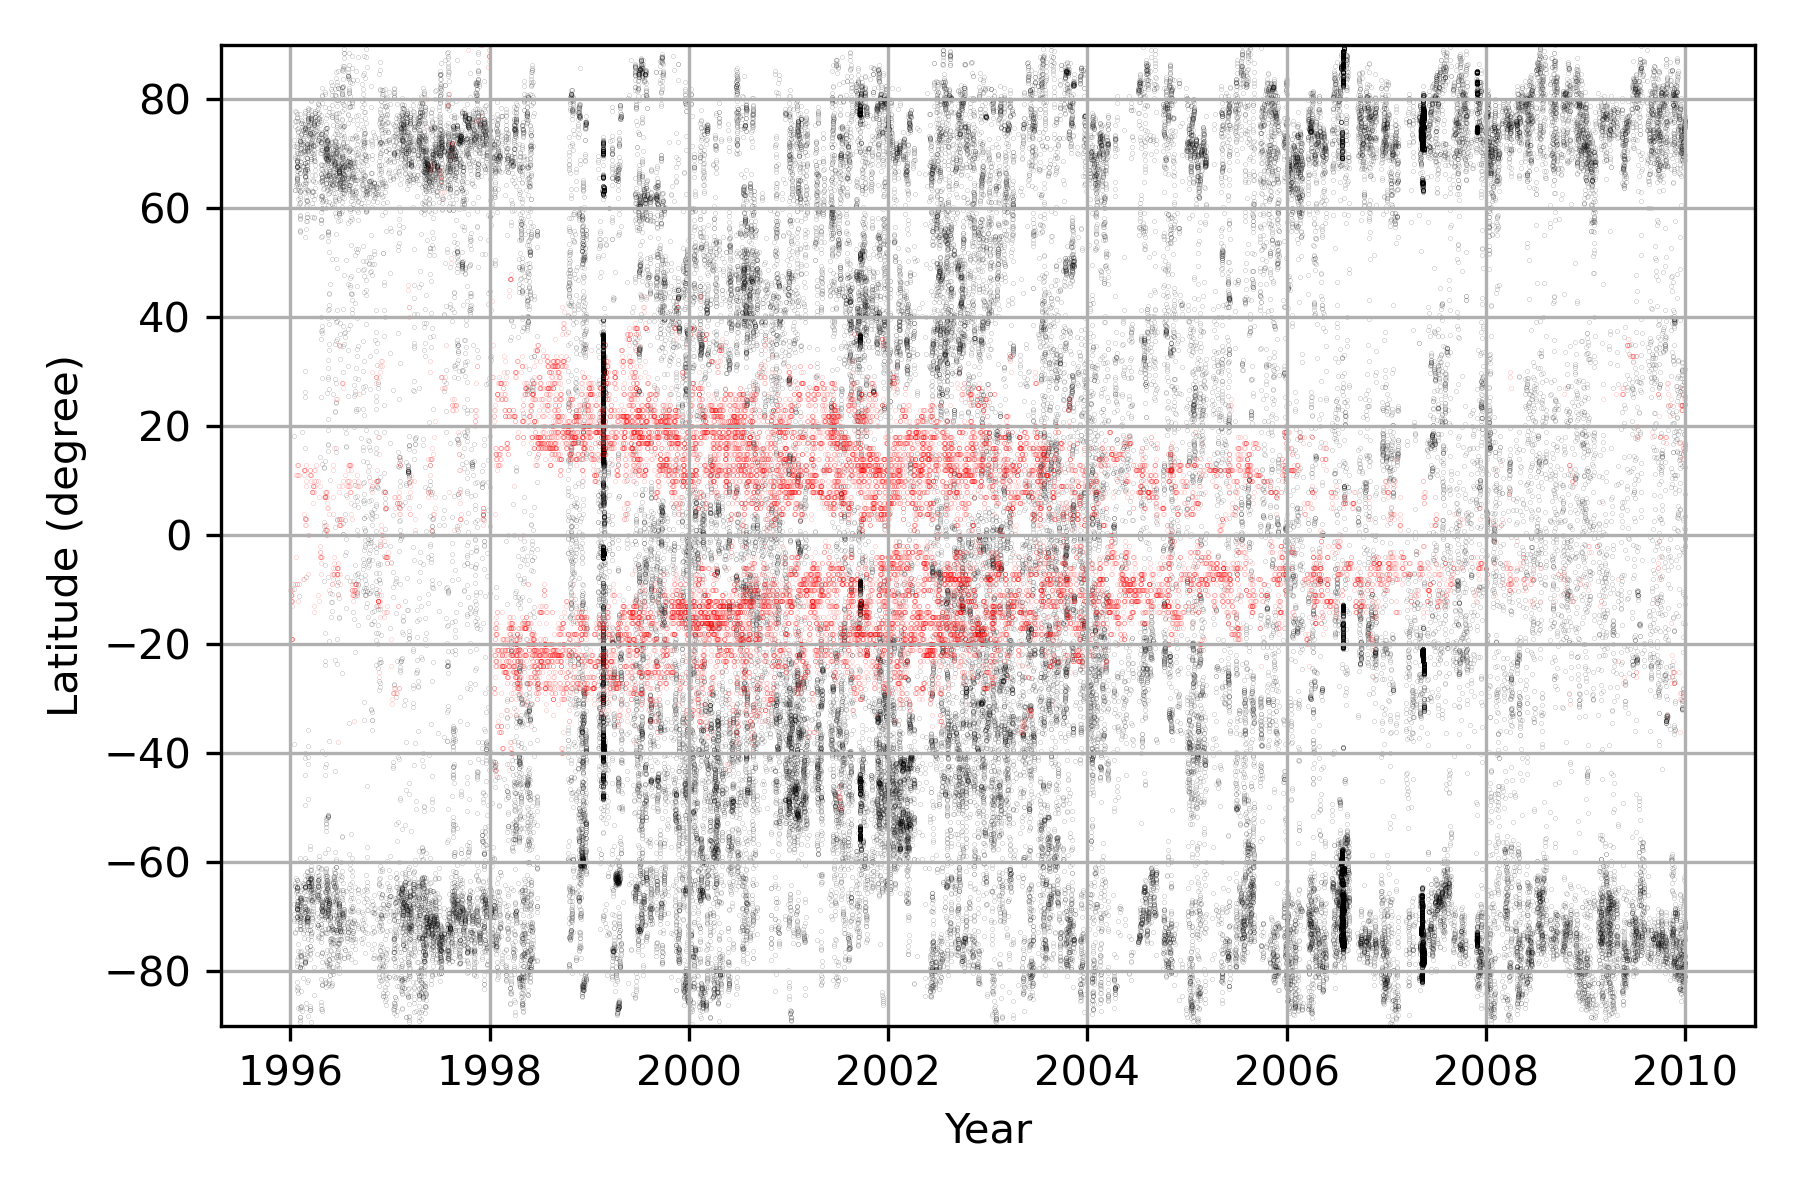
Latitude Distribution
Sunspot latitudinal distribution follows a beautiful butterfly pattern. We attempted to get an inverse of that pattern since coronal holes are found less in places where sunspots were high. We see some characteristics of such a distribution for the solar cycle we considered.
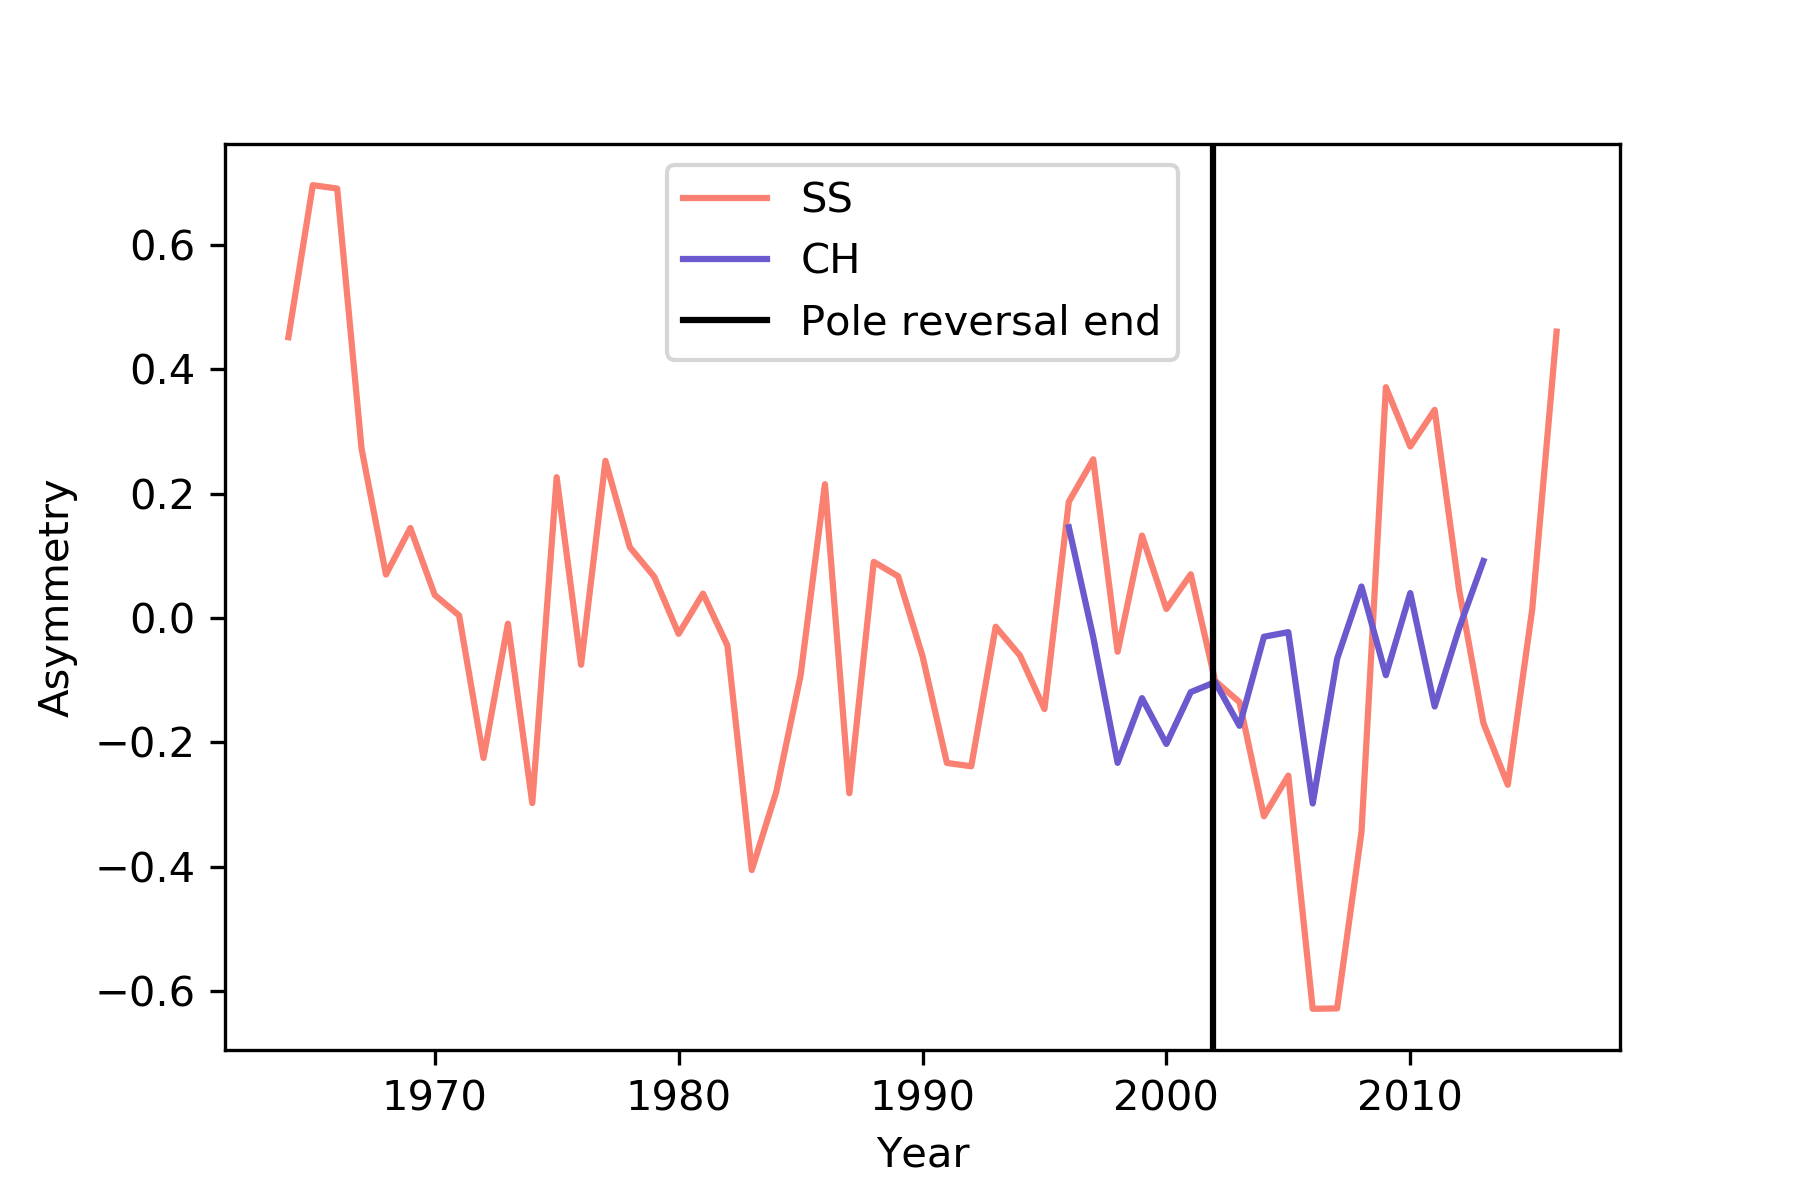
N-S Asymmetry
The distribution of sunspots and coronal holes is not random occurrences. They are influenced by the Sun’s magnetic field. This is seen as patterns, periodicity and asymmetries in the data. The lack of symmetry across the equator of the Sun is called N-S asymmetry. We observed that when the Sun’s polarity flipped, they converged. This means that there could be a relationship between the two phenomena.
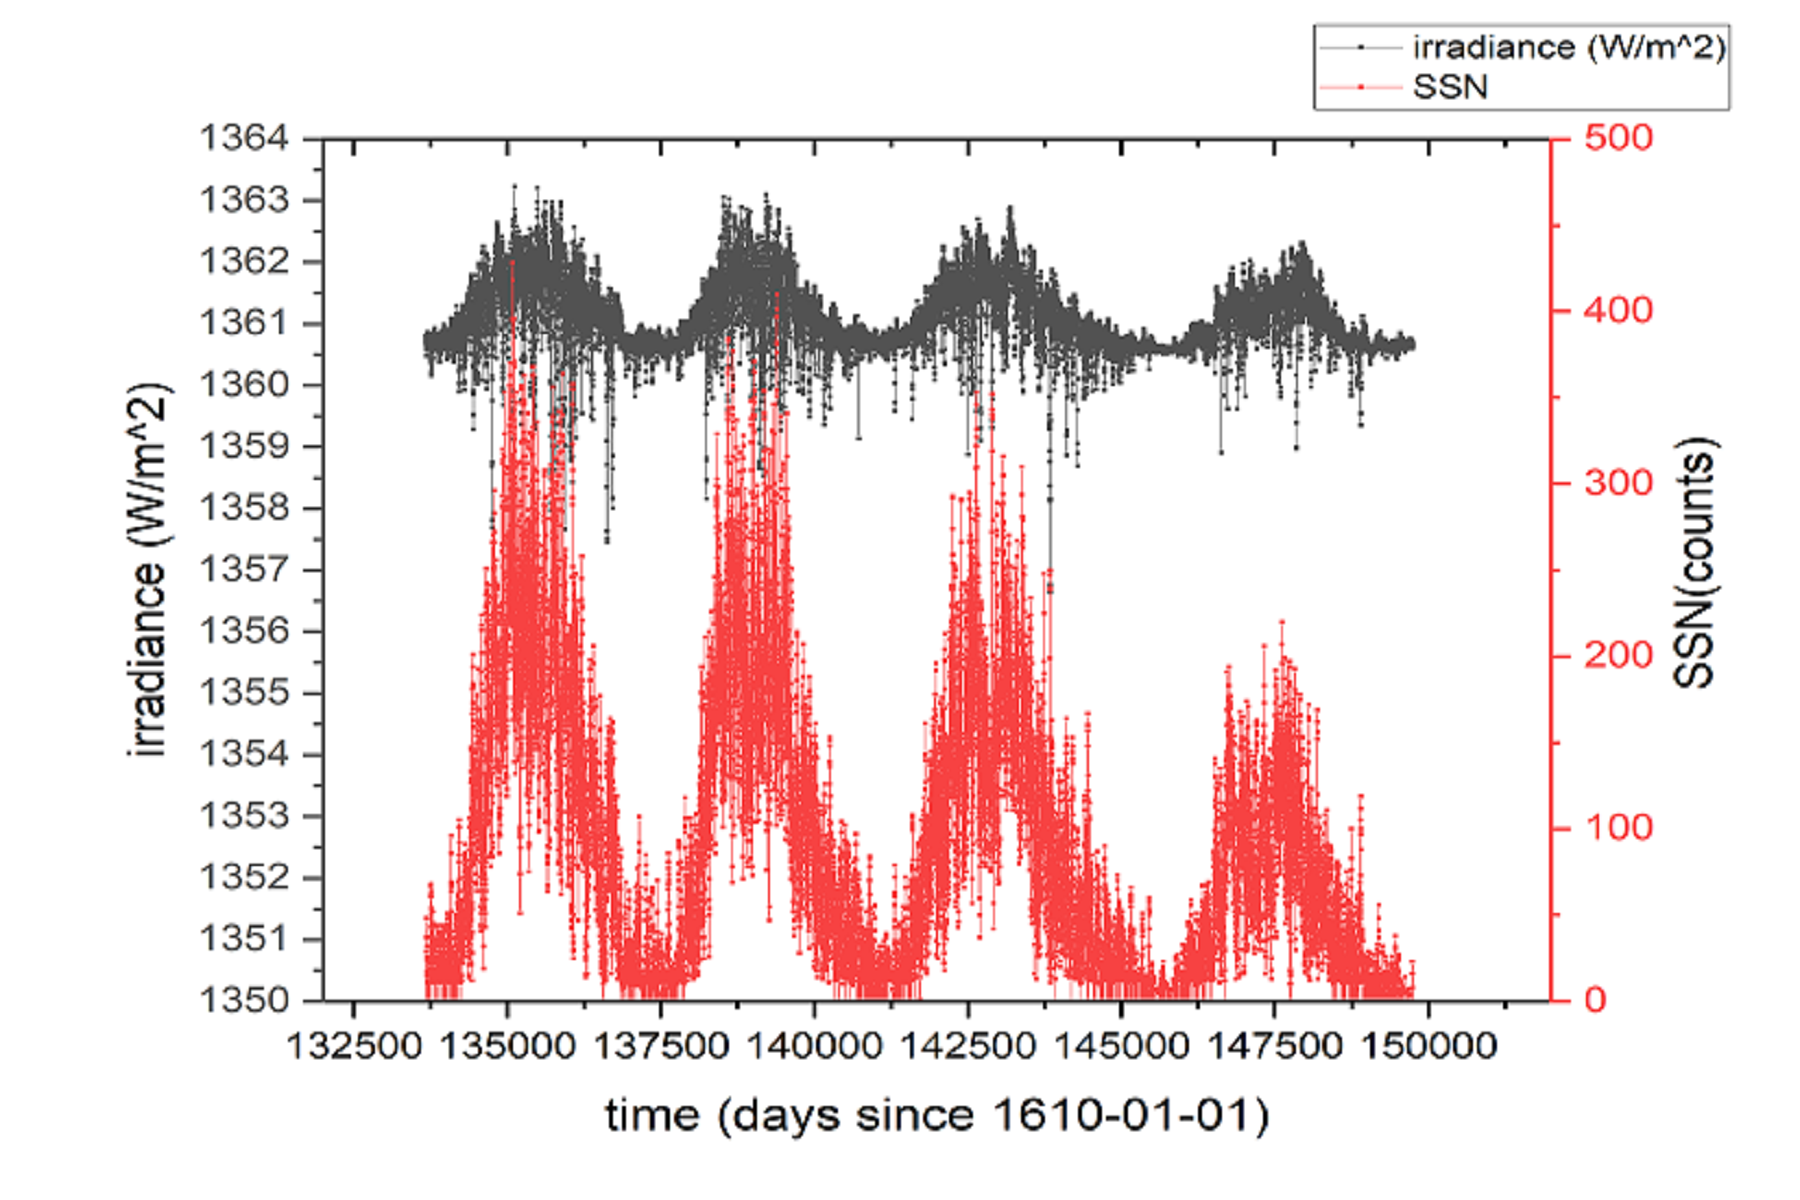
Irradiance & Sunspot Number
As evident from the graph, the Total Solar Irradiance (TSI) and the Sunspot Number (SSN) seem to vary similarly. Since they exhibit similar variation these two must exhibit a relation. We confirmed this is true with a few statistical tests. Our tests showed that they were correlated by a factor of 0.94, which is a strong correlation. The variations approximately followed a Gaussian curve for both TSI and SSN.
Conclusion & Future Scope
The first two results showed that there might be a relationship in the occurrence of the sunspots and coronal holes and also with the magnetic field. The third result verified a strong correlation between the solar activity and the total solar irradiance. All these results are statistically significant but to confirm our conclusions we would need to consider a longer period for the analysis. With more solar missions, this can be done and a strong conclusion can be made.